
NBA Playoffs 2022-2023 Analytics Project

Introduction:
The sport we decided to research for our project report is basketball, specifically the National Basketball Association (NBA), the predominant pro league in the United States. In the NBA, two teams compete against each other for four 12-minute quarters. The winner is decided on which team has more points by the time the fourth quarter timer expires. If the score is tied at the end of the game, a 5-minute overtime period is played under the same guidelines, and the teams will continue to play overtime periods until one team can finish with more points.
The NBA is the largest and most well-known basketball league worldwide, drafting players from inside the United States as well as international talent. The players in the NBA are the best basketball players in the world, with 560 active players in the league as of the most recent 2023-2024 season. Teams build their rosters by trading with other teams, signing players to contracts, and drafting young players in the NBA draft in hopes of finding cheap young talent. The Association has 30 active teams, each with 15 players on the active roster with 16 of those teams being eligible for the postseason. The teams are divided by conference and seeded by record and play best of 7 series until one team is left standing as the champion. The playoffs provide excitement for players and fans, with intensity increasing and players needing to play at the top of their games, it is a goal for every team to reach the playoffs. It also benefits the individual brand and business of the teams, as revenues skyrocket during the postseason. Multiple statistics are used to measure the impact and value that an individual player has on the game. While scoring more points is the overall objective of the sport, other aspects like passing, defense, and rebounding have a sizable impact on a team's success.
Research Question:
The research question we aim to answer during our analysis is finding out which players exceeded their regular season value the most throughout the 2022-23 playoffs. This question is relevant as many players across the league are known to either step up and exceed their regular season performance in the high-stakes environment of the playoffs, while others may tend to perform below their season averages. Playoff success is a large factor in determining how “clutch” a player is, or their ability to perform at a high level in big moments. This information can be important for general managers or coaches who are either looking to add an impactful player to their team or for determining what the best lineup is come playoff time.
Dependent Variables and Advanced Statistics:
One of the main data sources we are utilizing is basketball-reference.com, a subsite of Sports Reference. Sports Reference is a website that provides reliable and consistently updated datasets about a variety of aspects of each sport. We are downloading playoff and regular season statistic data files as an XLSX and uploading those data sheets into Excel to run our tests. In the case of our study, we will be using the 2022-2023 NBA Playoff and regular season statistical averages for these players. These datasets provide player totals, shooting percentages, per-game statistics, as well as advanced statistics. For the sake of our project, we will be focusing primarily on the advanced statistics section to determine the general performance of a player in both the regular season and the playoffs so that we can compare the two and find the differences. The dependent variables that we will be considering in this column are True Shooting % (TS%), Win Share (WS), Box Plus/Minus (BPM), Usage Percentage, and Value over Replacement Player (VORP).
VORP: Value over Replacement Player which estimates the points per 100 team possessions that a player contributed above a replacement level (-2.0) player, translated to an average team, and prorated to an 82-game season. This can be multiplied by 2.7 to get ‘Wins Over Replacement’
BPM: A box score estimate of the points per 100 possessions that a player contributed above a league average player, translated to an average team.
Win Share (WS): An estimate of the amount of wins contributed by an individual player.
True Shooting Percentage: An advanced statistic that measures a player's efficiency at shooting the ball. It is intended to more accurately calculate a player's shooting than field goal percentage, free throw percentage, and three-point field goal percentage taken individually.
Usage Percentage: Advanced statistic that measures the percentage of a team's possessions a player uses while on the court. It's calculated by adding together 100 times the number of field goals attempted, a third of assists, turnovers, and 0.44 times free throws attempted, and then dividing that number by the total number of possessions
To answer this question, we plan to use Python to predict the difference between each player's regular season and presumed playoff stats, to determine which players stepped up the most in the playoffs. Additionally, we will run a regression analysis to determine how different stats impact a player's value over a replacement player (VORP), to help teams find what kind of players they should look for. We plan to use dummy variables that categorize the players by each of the five positions, giving us the flexibility to run frequency tests using certain positional groups, as well as one that shows whether a player's data is from the regular season or the postseason. We plan to combine multiple of the earlier mentioned statistics into a single value that we will take for a player in both the regular season and the playoffs to measure a player's performance. The outcome variable will be the difference between a player's playoff performance and their regular season performance.
Data Set:
The data set we utilized to answer the research question was through importing filtered data from basketball references and importing that data into a CSV Excel file to further edit and include our dummy variables. We utilized both the 2023 playoff and 2023 regular season data for the players and imported the advanced statistics into our data set. Since we are determining potential correlations between regular season statistics and playoff statistics, we had four separate Excel sheets where we have the regular season advanced and normal statistics as well as the playoff advanced and normal statistics and combined them into one organized data sheet. In total, we are going to be analyzing over 217 individual players during the 2022-2023 regular season and playoffs. After combining the sheet, we imported the combined data into Python and wrote a function that gave us an additional data frame containing the difference between each player's regular season and postseason stats. Using a dummy variable for each position we can run a regression that includes all players who play that position to compare against the field and draw comparisons from.
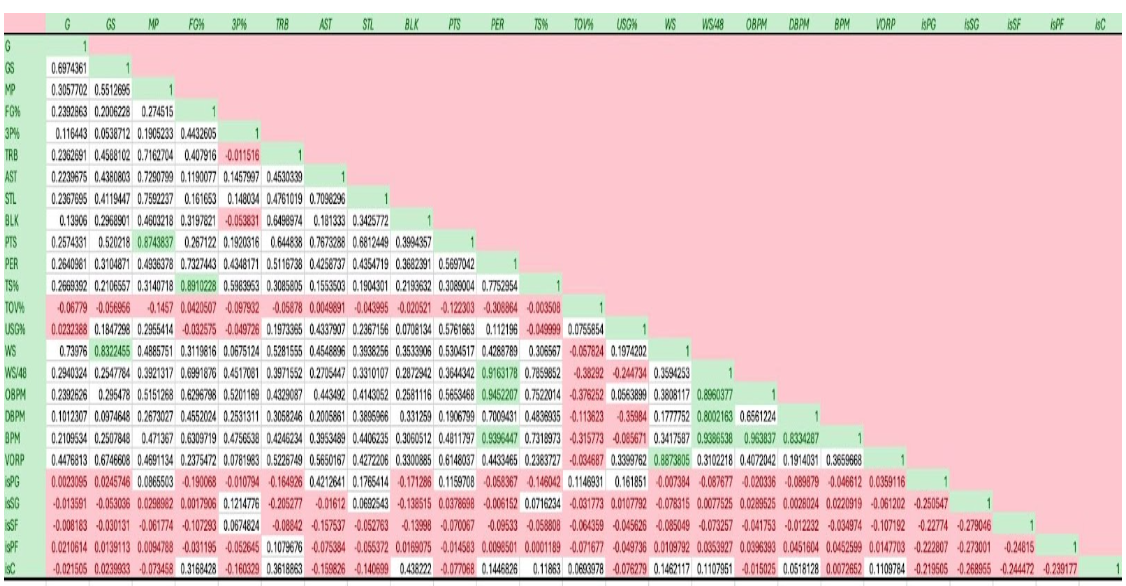
Ratio and Categorical Variables:
We utilized lots of variables, which we felt were essential for the data set to help answer our research question. Firstly we have our categorical variables which give us basic player information, which consists of position group, age, and team they played for. We can use these variables to run more specific tests and create dummy variables to hyper-analyze specific correlations between factors such as age and some of our other ratio data. In terms of ratio data it is the predominant variable type for determining surface-level opinions on players impact, therefore we have a lot of variables to help us categorize certain players and give us flexibility to run different types of regression tests. The variables we used for our analysis are listed below:
Games and Games Started (G) & (GS): Amount of times a certain player started or appeared in a game.
Minutes Played (MP): Average amount of minutes played for both postseason and regular season.
Field Goal Percentage: Percentage chance of making any shot.
3 Pointer Percentage: Percentage chance of making a 3 point shot.
TRB: Average of the total rebounds per game, both offensive and defensive.
AST: Average of the total assists a player gets per game.
STL: Amount of steals averaged per game.
BLK: Amount of blocks averaged per game.
PTS: Amount of points averaged per game.
PER: PER stands for player efficiency rating, which is a rating of a player's productivity per minute.
TOV Percentage: A statistic that estimates the number of turnovers per 100 plays into a percentage.
Histogram 1 Example:
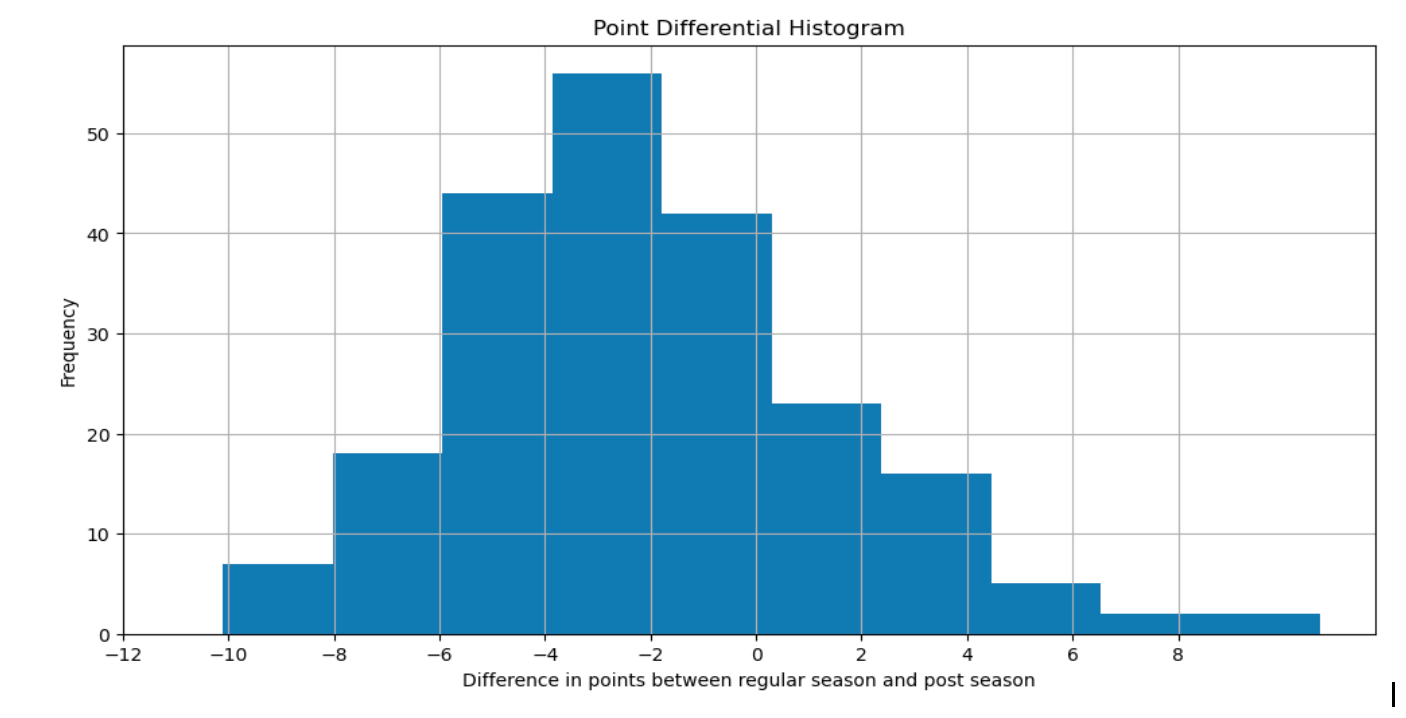
This histogram supports the notion that NBA teams play much tougher defense in the playoffs. Over 75% of NBA players saw their points per game average gp down in the playoffs. The top playoff risers in terms of points per game were Kawhi Leonard (+10.7), Khris Middleton (+8.7), Russell Westbrook (+7.7), Anthony Edwards (+7) and Jamal Murray (+6.1). The top playoff droppers were Joel Embiid (-9.4), Malik Beasley (-9.7), Reggie Jackson (-9.7), Thomas Bryant (-9.8) and Jordan Poole (-10.1).
Data Analysis:
Mean: 2.084651, STD: 3.527806, Min: -10.1 (Jordan Poole), 25th Percentile: -4.3, 50th Percentile: -2.5, 75th Percentile -0.25, Max: 10.7 (Kawhi Leonard)
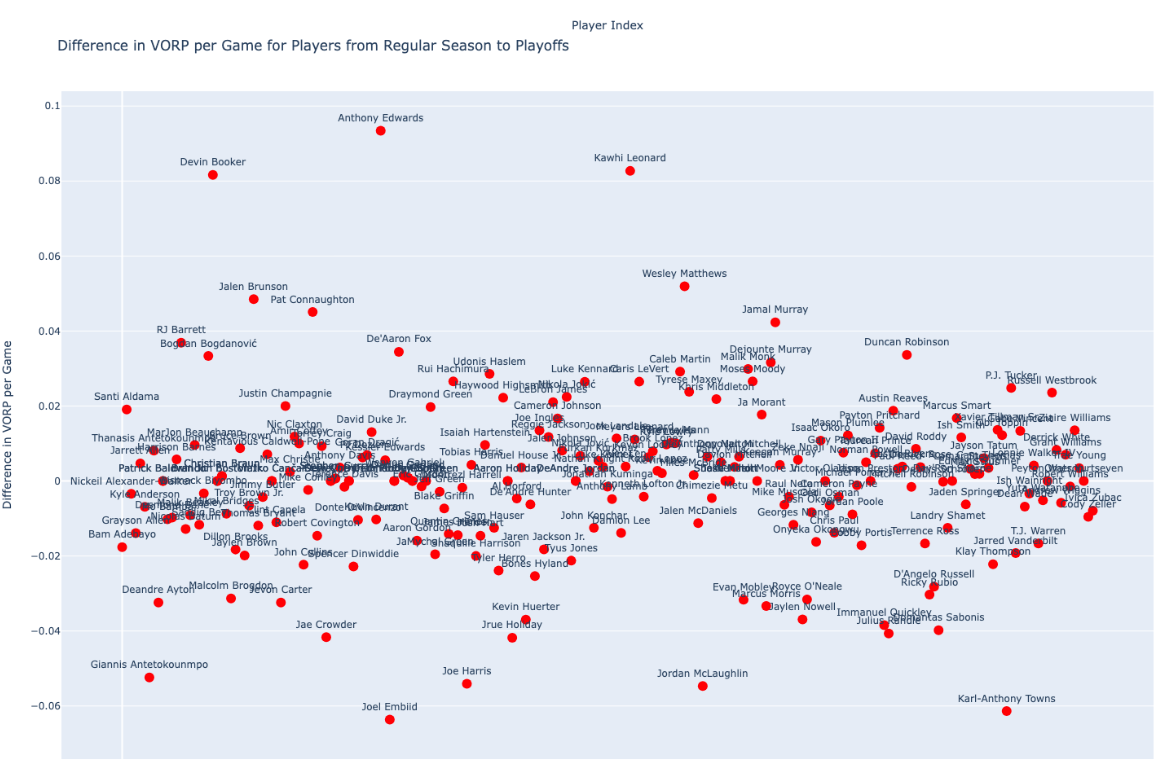
Histogram 2 Example:
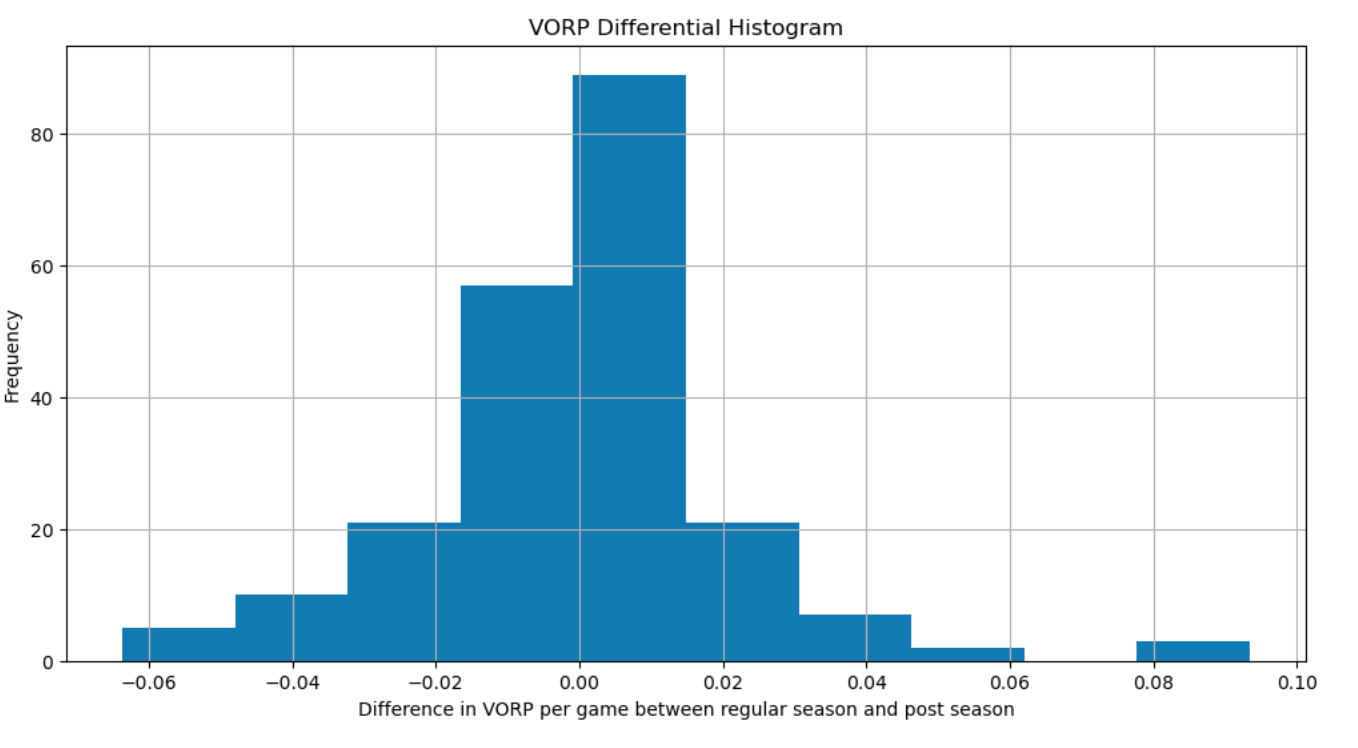
This Histogram shows that most players did not show a huge change in their value between the regular season and playoffs, this is proven by the fact that the mean and the 50th percentile of the histogram are both right around zero.
Data Analysis:
Mean: -0.000065, STD: 0.021514, Min: -0.63636 (Joel Embiid), 25th Percentile: -0.010694, 50th Percentile: 0, 75th Percentile: 0.009036, Max: 0.093418 (Anthony Edwards)
Applying our Data:
During our initial construction of our data set we ended up sorting through multiple different ratio variables in order to determine which ones were the most relevant towards answering our research question. By doing so we specifically were looking for stats that contribute to player and team value and straying away from more individualistic stats that we couldn’t draw correlations from. Using the advanced statistics as our dependent variables as mentioned in the introduction, we have more insights on player value both on offense and defense as well as how impactful they are with how much time they play, and their overall value per possession, with the other four teammates on the court. An example of why these variables give us a better understanding of both the research question as well as the data is if we for example decided to run a regression specifically using NBA All-Stars and their perceived value in the playoffs. Since All-Star selections are made in the regular season, their regular season data is going to be higher than that of an average player, but since we incorporated variables such as BPM, we can see if the amount of value a player like Anthony Edwards brings to his team come postseason time and compare that to his regular season baseline ratio numbers to draw correlations related to our research question.
Frequency Tables and Variation Measures:
Since we knew some of the subjects within our data set had been traded in the middle of the 2022-2023 NBA season, we decided to break up the table by the categorical variable ‘team’ and by doing so we were able to find 16 players who played in the playoffs but were involved in a mid season trade package. The biggest risers in playoff value according to VORP per game among these midseason acquisitions were, Rui Hachimura (+0.026587), Luke Kennard (+0.026441), and Russell Westbrook (+0.023562). The most common age among playoff players in general were between 24-26 years old, which made up about 31.5% of our data set. The youngest players to appear in the playoffs were 19 years old (Max Christie and Nikola Jovic) and the oldest player to appear was 42 year old Udonis Haslem. Breaking down our data set by position group in terms of frequency was something we wanted to prioritize in order to identify rising or more valuable positional groups and out of qualified players, 23.49% were shooting guards, 20.23% were small forwards, 19.53% were power forwards, 19.07% were centers and 16.98% were point guards.
Regression Equation:
Regular Season VORP per game = .0339 + .0053(points per game) -.0538(True Shooting %) + .0009(rebounds per game) + .0025(assists per game) - .0005(player efficiency rating) + .0048(box plus/minus) + .0063(win shares per 48 minutes) + .0005(usage %) - .0063(field goals attempted) + .0018(3 point %) + .0006(steals per game) + .0010(blocks per game) - .0050(turnovers per game)
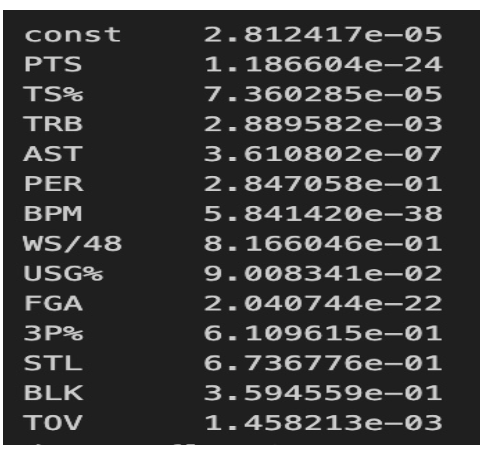
P Values listed above
The stats that have the greatest impact on regular season player value are points per game, true shooting, win shares per 48 minutes, and field goals attempted.
Playoffs Vorp Per Game = .0378 + 0075(points per game) -.0734(True Shooting %) + .0011(rebounds per game) + .0031(assists per game) - .0010(player efficiency rating) + .0047(box plus/minus) + .0128(win shares per 48 minutes) + .0007(usage %) - .0079(field goals attempted) - .0065(3 point %) + .0108(steals per game) + .0005(blocks per game) - .0090(turnovers per game)
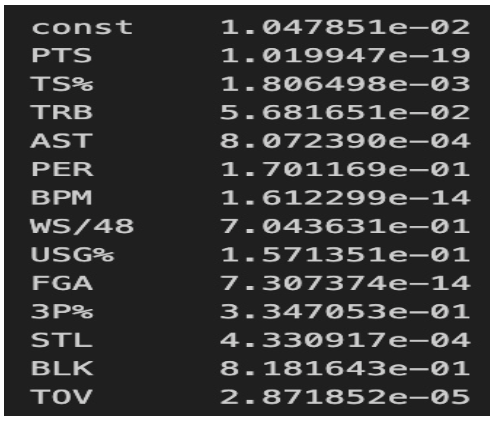
P Values listed above
As you can see scoring points became even more valuable in the playoffs and missed shots and turnovers were weighed more negatively. Points and possessions come at a premium in the postseason so every made basket is more important and every wasted possession is more devastating.
We would expect the biggest playoff risers to be players who can up their scoring averages while remaining efficient while also contributing on the defensive end with steals.
Analysis:
According to our findings from the analysis of our data, we found the biggest risers and fallers for the 2022-2023 NBA Playoffs using the VORP per game statistic as the dependent variable and used a scatterplot made in python to compare each players regular season VORP per game versus their playoff VORP per game. Our findings found that most of our subjects stayed along the median, but a few key players had significant differences. A trio of notable players that had the most significant rise in VORP per game in the playoffs were Anthony Edwards (+.0934), Kawahi Leonard (+.0827) and Devin Booker (+.0816). A trio of notable players that had the most significant drop off in VORP per game in comparison were Giannis Antetekounmpo (-.0524), Joel Embiid (-.063636) and Karl-Anthony Towns (-.061379). Even though all 6 of these players are NBA All-Stars, their value come postseason time severely differs from their regular seasons statistics.
While analyzing the data we thought of different variables that could potentially further explain why certain players drop off severely come playoff time, and why others rise to the occasion beyond expectations. A few factors that could explain this are the intense atmosphere of the playoffs, the game plan being more intense since teams play each other multiple times, pushed injury history, more intense defensive formations and finally players are more fatigued since they are asked to play more minutes. We found that 75% of players found their points per game average drop during the postseason, proving an emphasis on more efficient shooting and team oriented facilitating of the basketball. A unique finding that we were surprised about was how Jimmy Butler wasn’t higher on this graph, since he was the main contributor for a #8 seeded Heat team that made the Finals, but we figured this could be explained by his incredible high usage rate on slightly below league average efficiency. The Denver Nuggets won the NBA championship and despite playing the second most games of anyone in the playoffs, 3 out of their 5 starters (Nikola Jokic, Jamal Murray, Bruce Brown) registered above the 75th percentile of playoff risers in terms of vorp per game. The only Denver starter to not increase his value in the postseason was Michael Porter Jr.
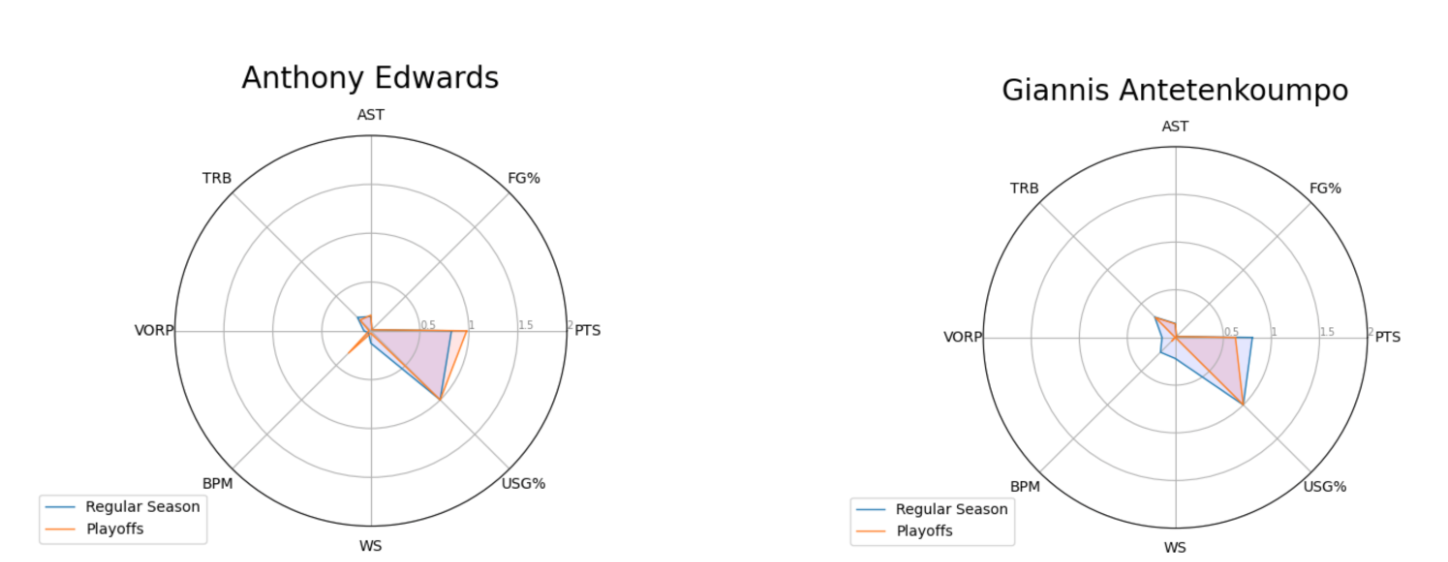
Pictured above is a radio plot for both Giannis Antetenkoumpo and Anthony Edwards. The plot depicts their regular season and playoff PTS, ASTS, TRBS, and advanced statistics. As shown, the blue portion representing the regular season is significantly favored towards the same advanced statistics we used to correlate player value with. As for Anthony Edwards, his radio plot is favored by the red portion representing the postseason as his value skyrocketed
Conclusion:
In conclusion we were able to predict playoff statistics for some of the NBA’s most exciting players based on their regular season statistics and our predictions can be supported by the per-game averages for our variables for the 2023 postseason. We are able to explain some of the variation in statistics based on multiple outside variables that contribute to basketball such as team chemistry, added defensive pressure in the postseason, higher decibel fan noise, and accounting for opponents game plans being more intense after playing each other potentially for 7 games in a row. Potential questions we had during our project revolved around the amount of games played in the regular season versus playoffs influencing the averaged statistics as well as which variables were most useful for our dataset and correlation analysis. Our findings based on our research question would provide very insightful information to NBA front office executives, the people who scout talent and know which buttons to press during roster construction in order to win a championship. These findings may also be beneficial for diehard NBA fans like ourselves, who want to know all about playoff statistics and more specifically which players on their favorite team that they can count on to exceed their perceived value during the big postseason moments.